Preliminary 2020 Greenhouse Gas Emissions Estimates for China
As most of the world experienced economic contraction in 2020, China’s industrial-led recovery kept the nation in positive territory. As a result, China is also the only major economy to experience an increase in emissions last year.
As most of the world experienced economic contraction in 2020 as a result of the COVID-19 pandemic, China’s industrial-led recovery kept the nation in positive territory, ultimately growing their economy 2.1% in 2020. As a result, China is also the only major economy to experience an increase in greenhouse gas (GHG) emissions last year. Based on preliminary energy and economic data, we estimate that China’s GHG emissions increased by 1.7% in 2020. While this is well below the 3.3% emissions growth that China averaged over the past decade, it is a worrying sign that the world’s largest GHG emitter’s focus on a fossil-fueled industrial recovery is at odds with its long-term goal of reaching net-zero emissions by 2060.
China’s emissions continued to grow in 2020
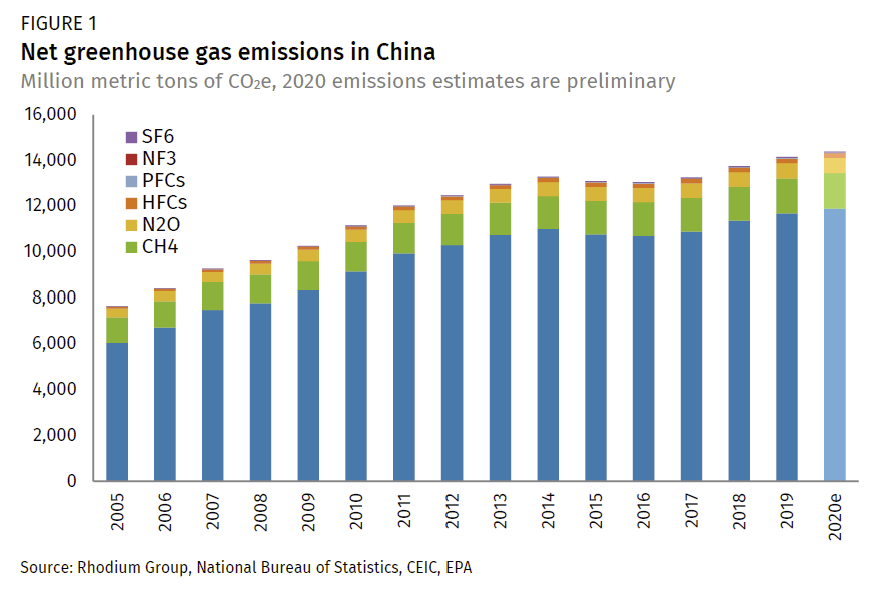
Although China is by far the largest emitter of greenhouse gases—producing almost triple the emissions of the US, the world’s second largest emitter—there is little up-to-date information on China’s annual emissions for all sources, sectors, and gases. The most recent comprehensive data from the Chinese government is over six years out of date. To fill this gap, Rhodium Group’s ClimateDeck provides a more up-to-date dataset of historical greenhouse gas (GHG) emissions in China, covering all sources, sectors, and gases. Based on preliminary economic and energy data, we estimate that total GHG emissions in China increased 1.7% in 2020, reaching 14,400 million metric tons (MMt) of CO2e (Figure 1). To put that figure in context, we estimate that is the equivalent of the total annual emissions of nearly 180 of the world’s lowest-emitting countries combined.
China’s GDP grew while other major economies shrank
China made headlines as the only major economy to avoid an economic contraction in 2020. As was the case during the Global Financial Crisis of 2009, China’s investment-led approach allowed it to weather the immediate crisis, with a focus on heavy industry and property construction. As a result, China’s economy grew an estimated 2.1% in 2020. But while China is an exception to the global trend, it was hardly unscathed by the economic fallout of the COVID-19 pandemic. Growth fell way below China’s 7.7% average over the past decade. China’s 2.1% growth also represents a significant drop from recent national GDP targets of around 6% (though China dropped its GDP target for 2020 given uncertainty raised by the pandemic). As China focused its stimulus response on fossil-intensive industries, its emissions increased accordingly. In the sections below, we summarize the overall impact of last year’s pandemic and stimulus response on China’s emissions in 2020.
Natural gas demand increased as oil and coal stagnated
Overall, we estimate that energy CO2 emissions increased by 1.2% to 10,190 million metric tons (MMt) in 2020. This growth rate is well below the 3.6% annual average over the past decade, largely due to the stalling out of coal and oil demand. In 2020, coal demand grew a mere 0.6%, the lowest it has been since 2016, and well below the average over the past decade of 1.6% year-on-year growth. Oil consumption took an even bigger hit in 2020 as transportation demand was significantly curtailed early in the year. Despite this, overall oil demand grew 0.6% year-on-year, though it was a far cry from the over 5% annual growth experienced from 2010-2019.
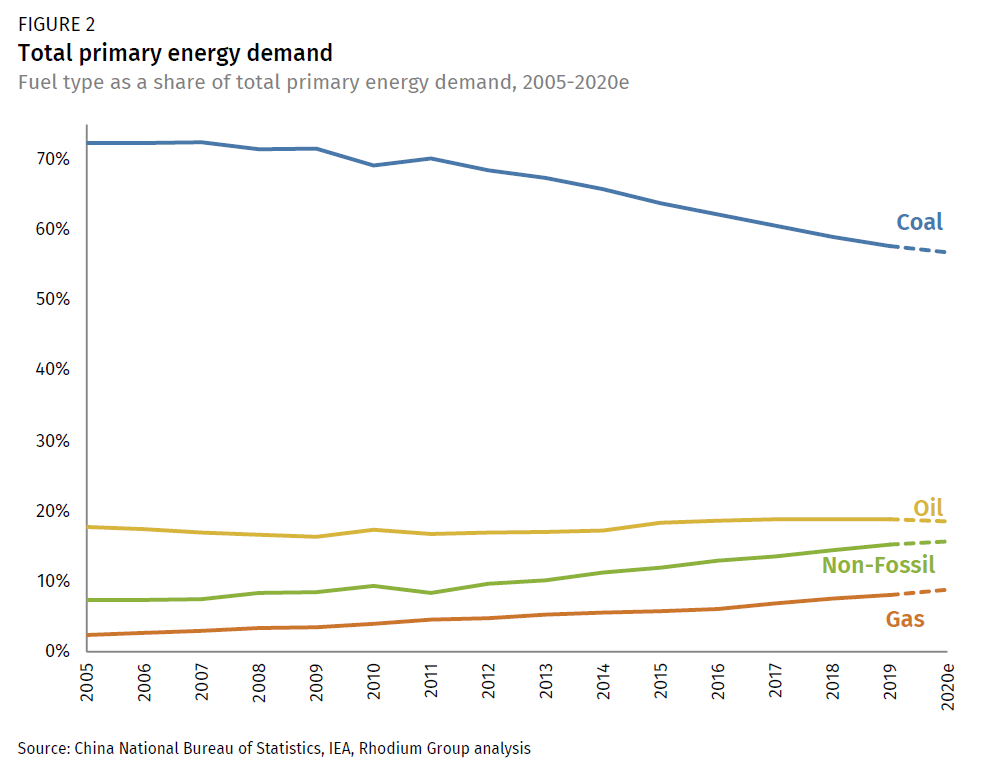
Natural gas demand, on the other hand, experienced higher year-on-year growth, with consumption—largely from industry—growing 7.2% in 2020, though below the 13% averaged over the past decade. Since 2010, natural gas has more than doubled its share of total energy demand, rising from 4% in 2010 to just over 9% in 2020 (Figure 2). Simultaneously, coal’s share of energy demand has dropped 12% over the past 10 years (to 57% in 2020), while oil’s share of energy demand has remained steady. Meanwhile, China’s share of non-fossil energy[1] has grown from 9% of total energy demand in 2010 to 16%, narrowly reaching its Copenhagen Accord pledges of 15% of total primary energy demand (TPED).
Industry: Carbon-intensive recovery driven by steel and cement production
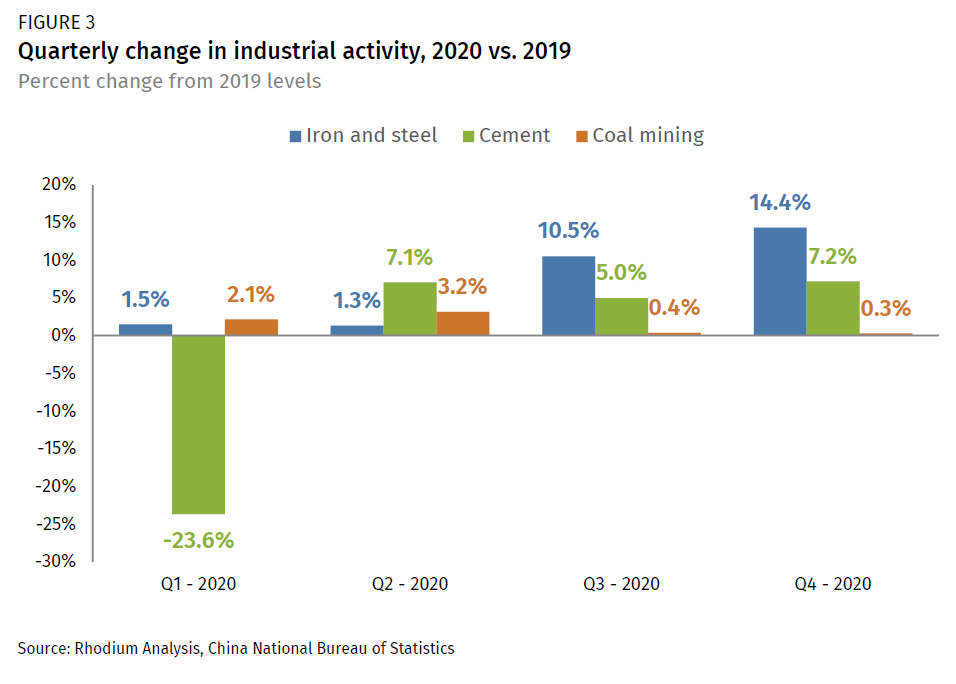
After the onset of lockdown restrictions in Hubei Province in January, China’s industrial activity declined substantially. In the first quarter of 2020, industrial activity fell by 11.7% year-on-year. However, as restrictions on movement and supply chains relaxed in April, industrial production recovered rapidly, aided by state support for industries that feed China’s construction-led growth. Cement and steel, for example, saw consistent growth for the entire Q2-Q4 2020 period compared to 2019 levels (Figure 3).
Overall, industrial and construction sector output (measured on a value-added basis) increased by 2.8% in 2020. Steel production led with 7.0% year-on-year growth, followed by cement (2.5%) and coal mining (1.4%). With much of China’s industrial growth focused on carbon-intensive industries like steel and cement, non-combustion process-related industrial CO2 emissions increased by 3.9% overall in 2020, down only slightly from 5% year-on-year growth in 2019.[2]
Electric power: Electricity consumption plummeted then rebounded
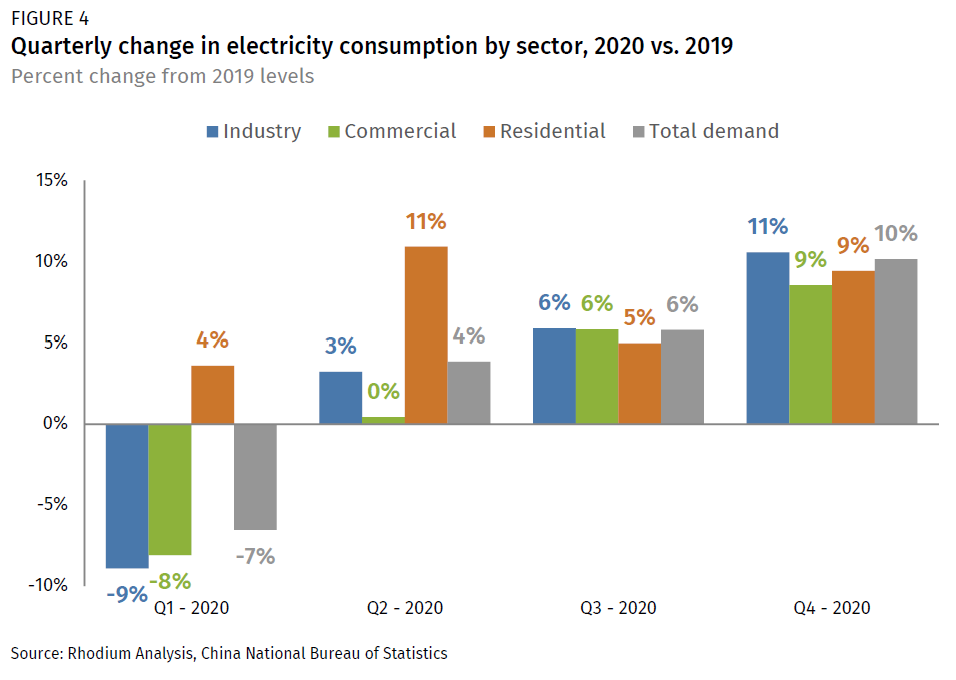
At the peak of lockdowns in Q1 2020, power demand dropped 7% compared to 2019 levels. But as lockdowns eased by Q2, power demand quickly rebounded, mostly driven by the recovery in the industrial sector (Figure 4). Overall, industrial electricity consumption (which comprises 68% of China’s total electric demand) increased year-on-year by 6.7%. Though initially lagging industry’s rebound, commercial electricity demand (16% of total electric demand) rose above 2019 levels by Q3, leading to an overall year-on-year increase of 1.9%. Residential electricity consumption (15% of China’s total electric demand) had the biggest year-on-year increase at 6.9%, likely due to stay-at-home orders.
Transportation: Jet fuel slumped while gasoline and diesel held strong
Although overall demand for transportation fuels increased by 0.6% year-on-year in 2020, it was a bumpy road for nearly all types of transportation demand. At the onset of lockdowns in January, many Chinese provinces experienced severe travel restrictions, with restrictions on non-essential travel and bans on international flights. As a result, demand for transport fuel slumped during the first months of 2020. Personal travel and freight rebounded when the domestic restrictions eased in the spring, but air travel remained low as the rest of the world locked down. The uneven recovery in the second half of the year meant that demand for fuels used primarily for on-road transportation rose overall in 2020, with diesel up 0.9% and gasoline up 2.8% year-on-year. Aviation did not fare so well, with overall fuel demand down 22% in 2020.
China met its 2020 Copenhagen Accord goal, but continued emissions growth jeopardizes its long-term Paris Agreement goals
In spite of the massive disruptions of the COVID-19 pandemic in China and around the world, a casual observer of China’s overall GHG emission trends over the past two decades would assume 2020 was a year like any other. Although at a slower rate than previous years, emissions continued to rise, driven largely by increases in fossil-fueled industrial activity encouraged by state-led stimulus. And yet despite that continued growth in emissions, China narrowly achieved its Copenhagen Accord pledges of reaching 15% of TPED from non-fossil sources and reducing the carbon intensity of GDP 40-45% below 2005 levels. Our preliminary estimates indicate that China achieved a roughly 40% drop in carbon intensity and non-fossil shares of 15.7% of TPED. Although China’s pledge was met, overall GHG emissions increased nearly 40% since the adoption of the Copenhagen Accord in 2009.
As countries finalize their international commitments for 2030 under the Paris Agreement this year and the world looks ahead to reaching net-zero emissions by mid-century, there will be increasing scrutiny on China’s plans for the coming decade to ensure that emissions peak as soon as possible and get on a rapid path toward meeting President Xi Jinping’s goal of reaching net-zero emissions by 2060. China’s current 2030 goals—increasing non-fossil share of energy consumption to 25% and reducing carbon intensity of GDP by 65% below 2005 level—fall far short of what will be required to get on track for that goal. All eyes will be on China this week as the nation plans to release its 14th Five-Year Plan, detailing its energy and climate goals for 2025. If 2020 is any indication, it will require a significant departure from status quo for China to shift away from its current fossil-heavy growth path.
[1] Fuel sources considered “non-fossil” for China include renewables (solar, wind, hydro, geothermal) and nuclear energy.
[2] Process CO2 is released not from fossil fuel combustion but other industrial processes. For instance, the chemical process to make cement produces CO2 when limestone is heated in a kiln to produce lime for cement production. This is separate from the CO2 produced from fossil fuel combusted to produce the high temperatures required to heat the kiln. Steel production also emits process CO2, at an intensity of about 1.1 tons CO2 per ton of steel.