China’s International Investment Position: An Update
The People’s Bank of China just released new data on the nation’s International Investment Position (IIP) at year-end 2012. This note summarizes important changes to China’s external balance sheet in the course of the last year and explores the policy developments and real economy trends that will shape the picture going forward.
A large swing in the financial account due to changing currency expectations: China’s financial account swung from a surplus of $260 billion in 2011 to a deficit of $21 billion in 2012. This shift is attributable not to massive hot money outflows, but rather to temporary shifts in the foreign exchange position of Chinese firms and households in response to RMB appreciation expectations.
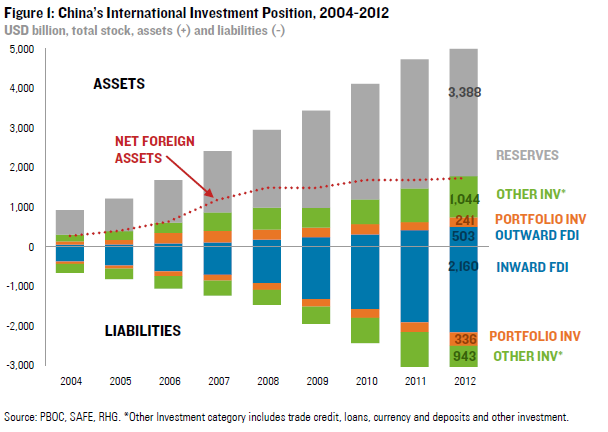
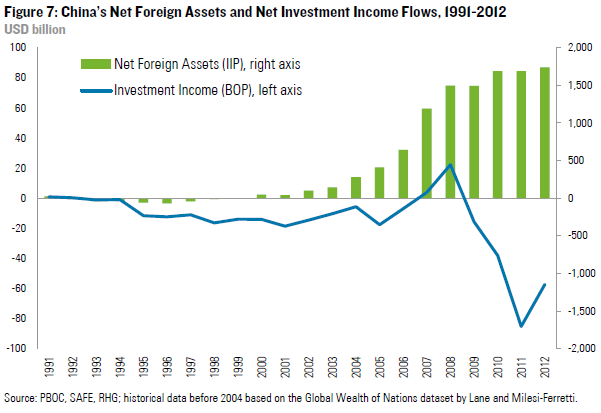
Further expansion of net foreign assets, but still negative investment returns: Net outflows of $21 billion under the financial account, the addition of $97 billion to official reserves and a $44 billion upward adjustment in the valuation of existing assets abroad lifted China’s net foreign assets from $1.69 trillion at the end of 2011 to $1.74 trillion in 2012. Despite this hefty net surplus in foreign assets, China remains a net interest payer to the world due to lower rates of return on its overseas assets.
Return to a financial account surplus in Q1 2013 but macro headwinds ahead: The financial account should have returned to a surplus in the first months of 2013 on the back of stronger domestic growth and renewed RMB appreciation expectations. However we expect China to face headwinds by mid-year 2013, triggering a swing in capital flows similar to Q2 and Q3 2012 – until the government finds ways to bolster confidence in medium-term growth.
Capital Flows in 2012
China’s balance of payments shows a dramatic change in cross-border capital flows in 2012. The financial account as a whole swung from a surplus of $260 billion in 2011 to a deficit of $21 billion in 2012. This was the first financial account deficit since 1998, when the Asian financial crisis triggered capital outflows. This shift was widely seen as evidence of capital flight in reaction to a slowdown in economic activity in the first two quarters of 2012. A dissection of the financial account shows that the reality is less portentous, having mostly to do with changing near-term perceptions about currency appreciation in combination with more freedom for firms and households to hold onto foreign exchange instead of surrendering it immediately to the central bank.
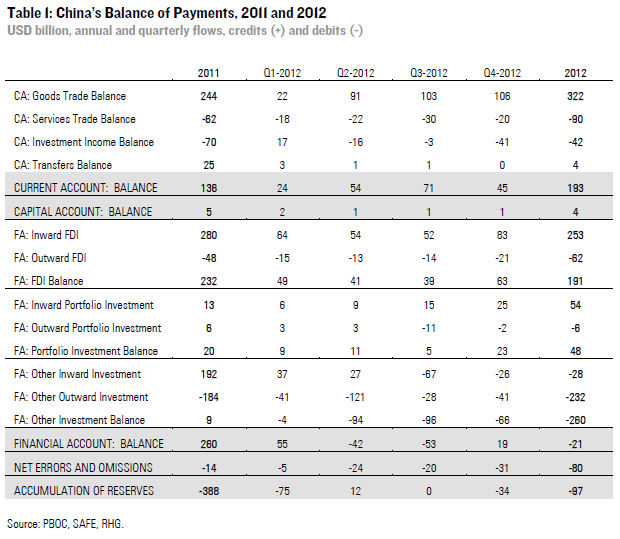
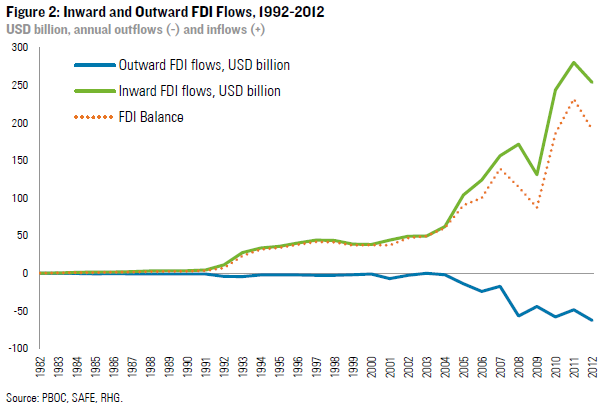
The balance of foreign direct investment (FDI) dropped from $232 billion in 2011 to $191 billion in 2012. The narrowing surplus results from both a rebound in outward FDI, which reached a new record high of $62 billion after a temporary drop in 2011, and a slight drop in inward FDI from $280 billion in 2011 to $253 billion in 2012. Possible explanations for this drop are a decrease in manufacturing investment in light of rising labor costs; diminished investment capacity due to economic malaise in Europe and other key investor countries; and a drop in the speculative “hot money” portion of FDI in light of a general growth slowdown and property sector tightening. While the gap between direct investment inflows and outflows is narrowing, outward flows are still far from catching up with inward flows (Figure 2).
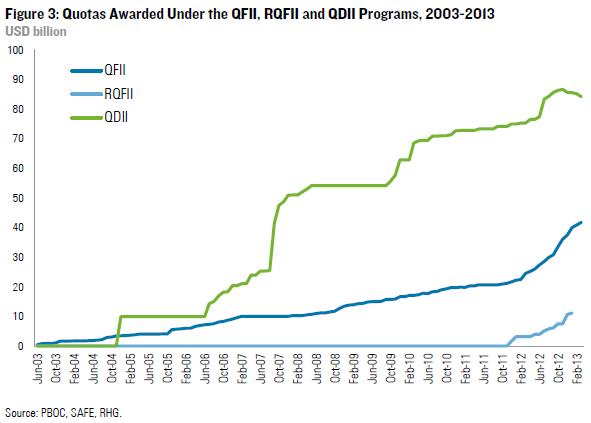
The portfolio investment surplus more than doubled from $20 billion to $48 billion. Inward flows shot up from $13 billion to $54 billion on the back of new policy initiatives to boost the participation of foreign institutional investors in China’s stock market through the Qualified Foreign Institutional Investor (QFII) scheme and other windows (Figure 3). Attractive valuations for Chinese securities also may have played a role, as the bulk of inflows occurred in Q4 when the Shanghai Composite Index hit a 3-year low. On the outbound side, signs of economic recovery in the US and stability in the Eurozone encouraged Chinese banks and qualified domestic institutional investors to invest in overseas securities in the second half of the year, after a period of downsizing their overseas holdings. Despite this increase in two-way flows, the value of portfolio investment flows remains small compared to the rest of China’s external balance sheet.
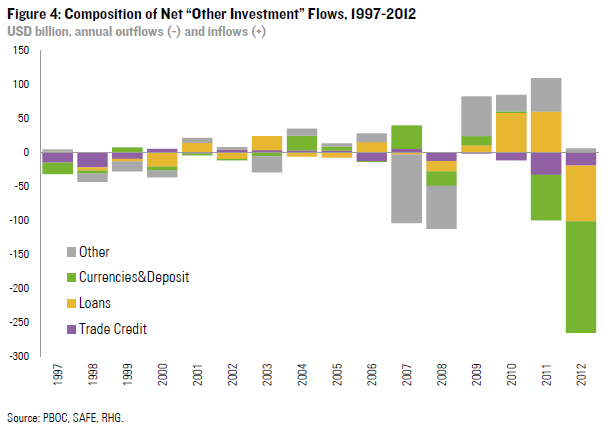
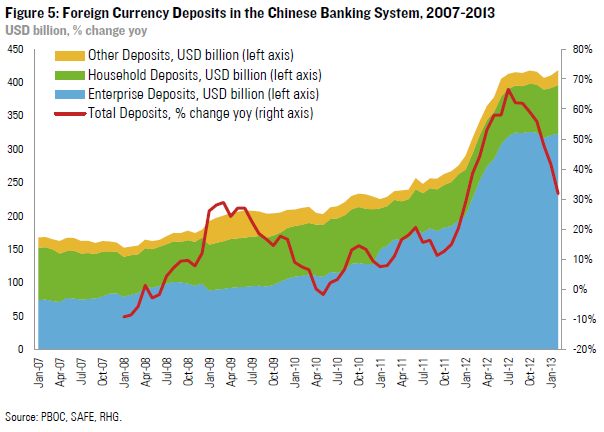
The most significant change in China’s financial account occurred in the “other investment” line of the BOP, which includes cross-border loans, trade credit, deposits and “other” flows. The balance here has changed from modest inflows of $9 billion in 2011 to a record $260 billion of outflows in 2012, driven by loans and deposits (Figure 4). These patterns do not represent large-scale capital flight but rather a temporary change in the foreign exchange position of Chinese firms and households. Before 2007, China’s foreign exchange regime forced firms and households to convert all income from current account transactions immediately into renminbi. This “surrender requirement” has been gradually loosened since then, giving firms and households more flexibility to hold FX they earn abroad. In the past, Chinese residents had an interest in immediately converting their FX income in expectation of further appreciation of the RMB. Last year, however, those expectations reversed, motivating a desire to maintain foreign currency deposits. We saw a similar pattern, briefly, in 2008 when RMB adjustment was put on hold, but the scale is much larger this time (Figure 5). The “loan” position is similarly affected by currency expectations as banks and firms that are in a position to make choices between keeping foreign exchange or trading it in for RMB optimize their FX exposure.
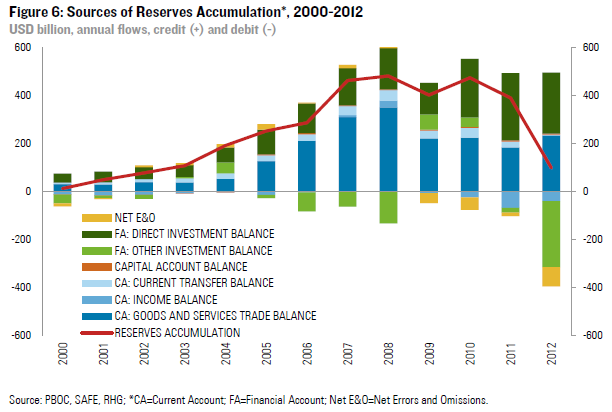
The $270 billion swing in the financial account and record high errors and omissions of $80 billion are responsible for another major change in China’s external patterns: a sharp drop in the accumulation of new official reserves. Despite a current account surplus rebound from $136 billion in 2011 to $193 billion in 2012, China’s State Administration of Foreign Exchange only added $97 billion to its existing $3.26 trillion in reserves, the lowest annual addition since 2002 (Figure 6). As explained above, this mostly represented a shift of foreign exchange from the central bank to the balance sheets of domestic banks.
Valuation Changes
A second factor changing the profile of China’s international investment position (IIP) is fluctuation in the valuation of existing assets – as summarized in Table 2. On the asset side, China’s IIP booked gains on almost every position except “other investment”, resulting from exchange rate effects and changes in market valuation. Foreign assets in China also profited from mark-to-market adjustments, with the exception of foreign direct investment assets which were unchanged.
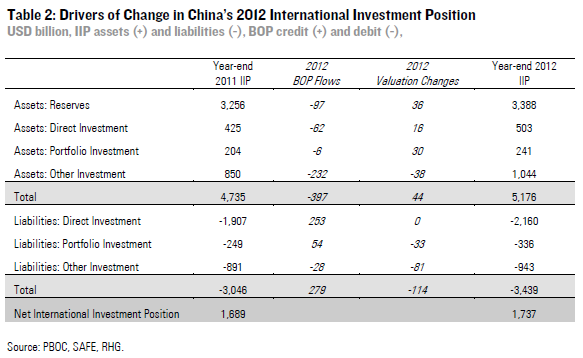
Accounting for those valuation changes, China’s international assets grew by $441 billion or 9% in the course of 2012, resulting in a year-end position of $5.2 trillion. China’s international liabilities – foreigners’ claims on assets in China — grew by $393 billion to $3.4 trillion at year-end 2012, an increase of 13% over the previous year. China’s net foreign assets (NFA) — international assets minus liabilities – therefore grew from $1.69 trillion in 2011 to $1.74 trillion in 2012, a year-on-year increase of 3%. The pace of net foreign asset growth has slowed to an annual average of 4% in 2009-2012, compared to more than 50% in the pre-crisis years (2004-2008). China’s year-end 2012 IIP position is summarized in Figure 1.
Investment Income Flows
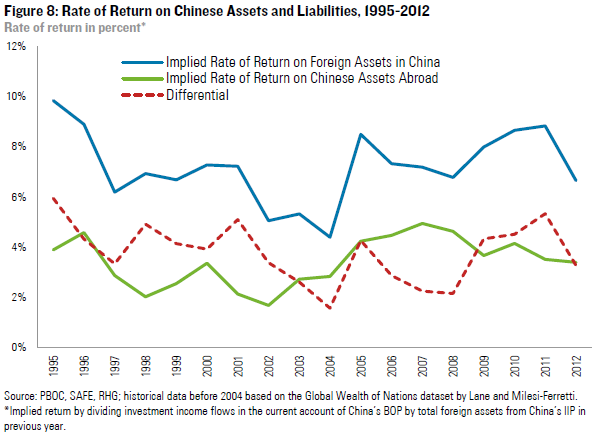
Despite its hugely positive net creditor position, China’s net investment income balance remains deeply negative. In 2012, China paid $201 billion in investment income to foreigners but only received $143 billion in investment income from abroad (Figure 7). The negative income balance reflects the contrasting composition of holdings on the asset and liabilities side. China’s global assets are dominated by reserves holdings and “other investments” while higher yielding asset classes such as portfolio investment in equities or direct investment stakes still account for only a small share of China’s global assets. The picture is reversed on the liability side, which is dominated by foreign direct investment and portfolio investment in equities – assets that historically have higher returns. Using the data points provided in China’s IIP and BOP, the implied difference in the effective rate of return between Chinese overseas assets and foreign assets in China hovered around 3-4% in recent years (Figure 8). In 2012 the gap was in the lower range due to a drop in rate of return on foreign assets in China while Chinese returns on foreign assets only slightly edged down.
Outlook: Capital flows in 2013 and Beyond
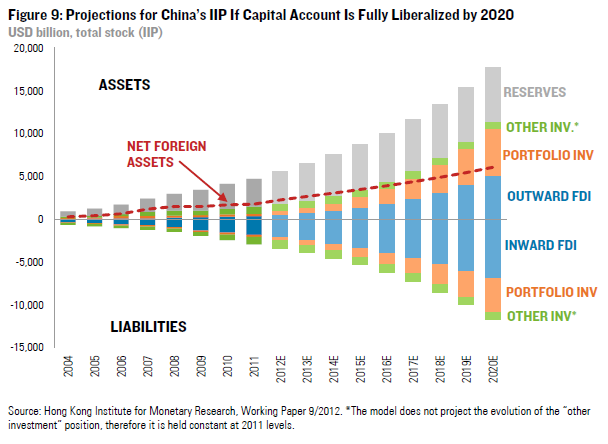
Going forward the evolution of China’s IIP will depend largely on the pace and extent of financial account liberalization. The extension of Zhou Xiaochuan as PBOC Governor beyond normal retirement age augers well for faster opening, but there are many countervailing factors. At the National People’s Congress in March2013 and other recent appearances, Zhou reaffirmed that China was committed to liberalizing the financial account by 2020. In a recent paper, researchers at the Hong Kong Institute for Monetary Research have mapped out what this would mean for China’s IIP using parameters from the historical patterns of other economies (Figure 9).
In the near term the most important determinant of Chinese capital flows is sentiment on the domestic economy. Since Q4 2012, the growth outlook for China has improved and the financial account should have return to surplus in Q1 2013. The FDI and portfolio investment balances are largely stable, while the “other” investment balance should return to pre-2012 patterns with more confidence in growth and further RMB appreciation. Indeed after the modest full year 2012 additions to China’s official reserves, $110 billion in additions were reported for January 2013 alone. However our macro view is that China will encounter economic headwinds by mid- 2013, as discipline in property and return to more normal outlays on rail and other infrastructure depress the contribution of fixed investment to growth. Baring another expensive stimulus program we are likely to see a repeat of some version of the events of Q2 and Q3 2012, with firms holding on to their foreign exchange in onshore and offshore accounts, and some hot money flowing out through the FDI and trade channels.
Beyond short term currency expectations, China’s macroeconomic policy course will be an important determinant of cross border capital flows in the coming years. Beijing’s reaction to sagging growth and the challenges of a “middle income trap” will almost surely include steps toward market efficiency, regulation, corporate governance, rule of law, and market contestability for private and foreign firms. Each of these moves will be attractive for global capital. At the same time, that liberalization will entail still greater mobility for domestic Chinese capital, slower (though sustainable) domestic growth, and the approach of equilibrium for exchange rates and interest rates. All those factors will encourage Chinese residents to consider diversifying away from their present “home bias” to a more balanced portfolio. In short, if Beijing takes the route of significant “big bang” reforms to sustain domestic growth, we will see significant growth in two-way capital flows in coming years. The huge pool of foreign exchange reserves accumulated over the past decades gives Beijing a big enough buffer against the short-term volatility in capital flows that could result from such a path.