China’s International Investment Position: 2014 Update
The People’s Bank of China just released full year 2013 data on China’s Balance of Payments (BOP) and International Investment Position (IIP). This note describes the most important changes in China’s external balance sheet last year and discusses Beijing’s near-term policy priorities with regard to cross-border capital flows.
China’s combined cross-border assets and liabilities reach $10 trillion: China’s global assets grew 14% last year to $5.94 trillion, driven largely by accumulation of reserves and outward FDI. Foreign assets in China expanded 18.5% to $3.97 trillion as economic growth and currency expectations pulled in foreign investment.
China’s unfavorable balance sheet structure continues to worsen: Despite its hugely positive net foreign asset position of $1.97 trillion, China paid $60 billion of net interest to the world last year, due to lower rates of return on its overseas assets. Fast growth of reserves and inward FDI in 2013 further cemented this structural problem.
Beijing’s near-term priorities are the crackdown on speculative capital and FDI reforms: In addition to clamping down on speculative short-term capital flows by allowing more volatility in the yuan exchange rate, Beijing will focus on reforming outbound and inbound FDI regimes and experiment with more freedom for cross-border capital flows in the new Shanghai Free Trade Zone.
The Evolution of China’s IIP in 2013
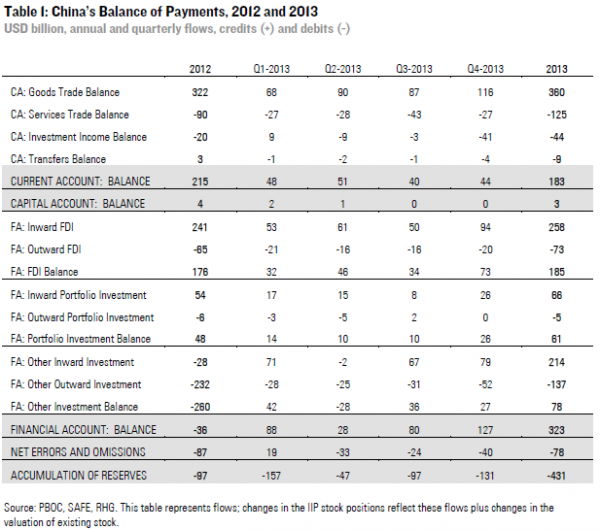
China’s external assets grew from $5.21 trillion in 2012 to $5.93 trillion at the end of 2013, which is broadly in line with the 10-15% year-on-year growth rate in past years. The fastest growing asset categories were reserves and outward FDI. Outward FDI continued to grow as Chinese firms are eager to expand overseas, albeit at a slightly slower pace than in previous years. Growth in reserves was the fastest since 2010, as both current and financial account were in surplus and restrictions on the outflow of private investment forced the central bank to mop up surplus foreign exchange.
China’s external liabilities (foreigners’ claims on assets in China) expanded from $3.35 trillion in 2012 to $3.97 trillion in 2013. This increase in the growth rate of foreign asset ownership in China (18.5% yoy growth, compared to only 9.9% in 2012) represents an upswing in the appetite of firms in holding RMB assets, as the sentiment on economic growth and yuan exchange rate appreciation turned positive after some bumps in 2012. Inward FDI and portfolio investment stock both increased at low double digit rates (13.5% and 15.1% yoy), while the stock of “other investment”, representing shorter-term instruments such as trade credit and deposits, surged 30.6% yoy.
Net foreign assets and Returns
China’s net foreign asset (NFA) position — international assets minus liabilities –widened from $1.87 trillion in 2012 to $1.97 trillion at year-end 2013. China maintained its position as the world’s second largest creditor after Japan, with Germany in third place.
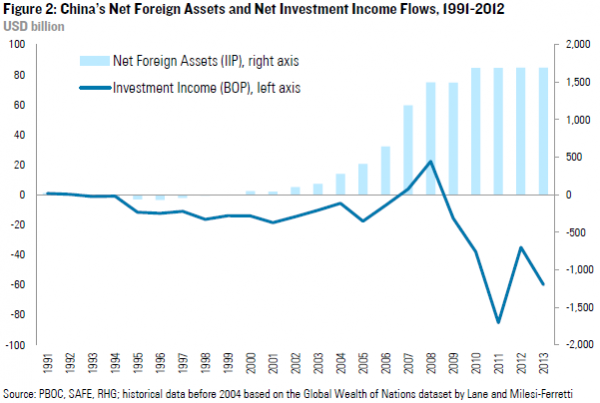
Despite this hugely positive NFA position, China remains a net payer of investment income to the world. In 2013, China received income payments of $168 billion on its assets overseas, but paid $228 billion in interest to foreigners, resulting in net investment income payments of $60 billion (Figure 2). The reason for these negative net income flows is the composition of China’s external balance sheet: more than two-thirds of China’s assets are reserves, which are managed by the central bank and invested in US Treasury bonds and other highly liquid securities. As the yield on these instruments has tanked in recent years, the implied rate of return on China’s overseas assets has dropped to an average of only 3% in recent years. Foreigners, on the other hand, mostly hold FDI assets in China, which helped to sustain the implied return on foreign assets in China at 6-8% during the same period of time.
Outlook
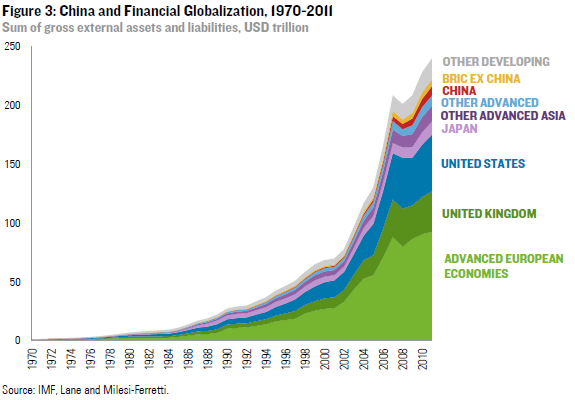
Despite the significant expansion of China’s external assets and liabilities in the past decade, from $1.5 trillion in 2004 to $10 trillion t0day, China’s total external balance sheet remains small when compared globally. China is now the world’s second largest economy (12% of global GDP), but still only accounts for 3% of global financial cross-border assets and liabilities (Figure 3). China is poised to take a greater role in the global financial system in coming years, but two-way capital flows will depend on the pace and sequence of capital account liberalization. China’s central bank has issued an ambitious timetable to achieve a freely convertible currency by 2022 (here and here), but Beijing’s short-term priorities are the reform of the domestic financial system, clamping down on speculative short-term flows, and deepening existing channels for “sticky” long-term flows such as FDI.
In addition to greater volatility of the yuan exchange rate to shake out speculators, we expect Beijing to deepen FDI reforms in coming months. The latest change of approval requirements was an important step to relax controls on FDI outflows, but the most recent Government Work Report put forward the ambitious goal of transitioning to a registration-based system. After years of slow progress, China’s negotiations with the US and EU about bilateral investment treaties could be a catalyst for reforms of the inward FDI regime as well. There are signals that China is ready to transition to a modern FDI regime under which foreign investment is only restricted by a “negative” list of restricted sectors and narrow screenings for national security and competition policy concerns. Finally, the new Shanghai Free Trade Zone will allow the government to experiment with greater freedom for trade accounts, cross-border lending, outward investment and currency conversion, which will help facilitate the liberalization of cross-border capital flows on a national scale.


